A cybersecurity view of COVID vaccine vendor chain.
A few days ago, I read one of the most interesting articles that I’ve seen in a while, about how Jonas Neubert, essentially attempted to reverse engineer all vendors involved in the entire development, production and shipping chain for the COVID vaccines.
It’s a great article, go read it, I’ll wait.
Now vendor chains is something I really care about. I spend all day looking at organizations, their connections and dependencies, technologies and hosting providers, as part of the work I do.
So when I read this article, my mind immediately started asking questions like:
- What are the common technologies between all these vendors?
- Hosting providers used?
- Types of vulnerabilities we can see?
The best part is, I have everything I need to get those answers:
1 - Who are the vendors and their main domains (Jonas did the hardwork here)
2 - I can just type company names into ASM and it takes care of the rest!
First of all for both the Moderna and Pfizer/BioNtech vaccines here are the vendor chains.
Looking at the plot, we can see there are some vendors that are shared between the two main vaccines:
- Schott
- Kuehne+Nagel
- Fedex
- University of Pennsylvania
If you’re thinking like an attacker, this picture also presents an extremely interesting perspective. Think back a few weeks to what we saw happening with Solarwinds or this week with Centreon.
A vendor got hacked, and from there attackers were able to pivot to other organizations.
Next lets take a look at dataleaks. These are where an attacker first looks when gathering information about a victim. You get access to social profiles, passwords, usernames, and a bunch of other information that you can use for different types of attacks, from social engineering, phishing, or even credetial stuffing or bruteforcing.
Lots of dataleaks are found across the entire chain. Lots of credentials ready to be used and re-used by attackers, lots of emails ready to be phished.
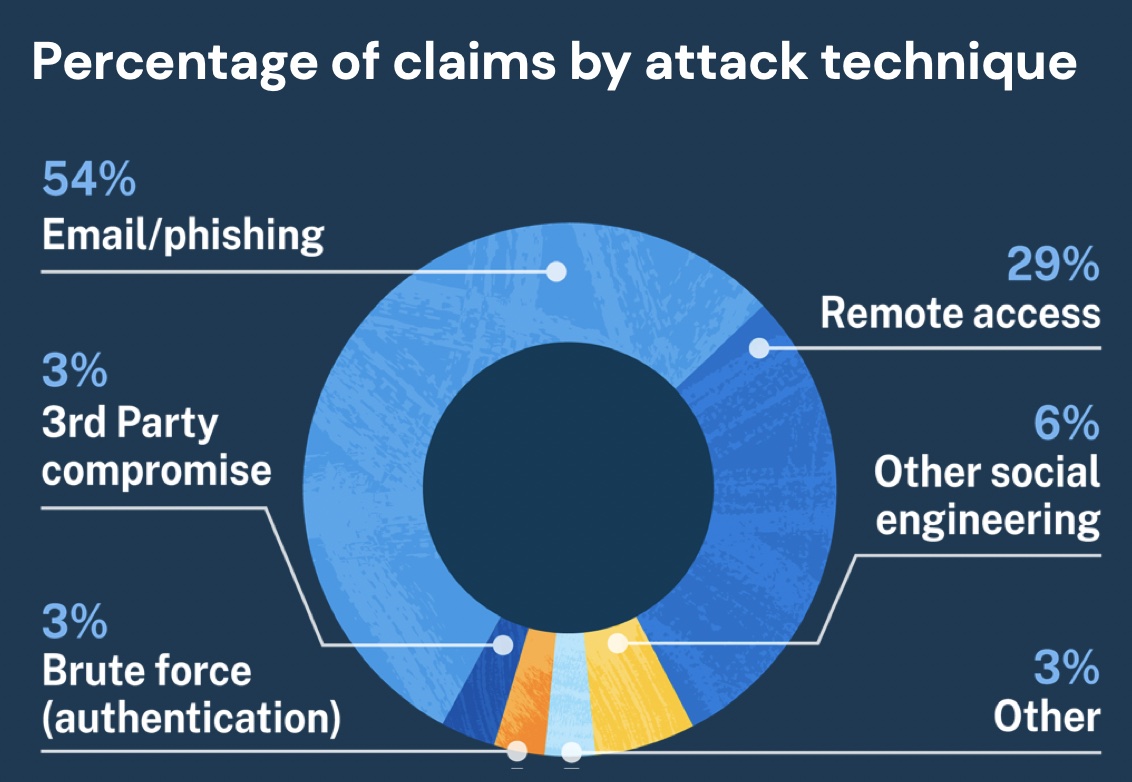
If you take a look at our Claims report for 2020, you will see that these are a high percentage of attack techniques we see.
As a next step lets take a look at all domains,subdomains and assets of these organizations. Here we see the geographic distribution of these assets:
These assets are distributed across multiple ASNs, providers and geo locations. It’s interesting to think about how politics in real-world can affect some of the location of these assets from a governance, compliance and cybersecurity lens.
Looking at these assets we can extract the top subdomains found, I colored the ones that I believe would be attractive to attackers from my previous experience doing pentesting and now doing large scale organization mapping and scanning.
These are subdomains that our customers typically focus and tag as important assets to them.
One growing concern I have had for a while, is the attack surface that is growing from the software side (thought typically my focus is on the network components. How many javascript libraries are you using on your project when you do your npm install? what are their dependencies? where are they coming from? what are the intentions of their developers?
We’ve started to see the dark side of these issues pop up more in the last few years, with one showing up just a couple of weeks ago - read about it here.
So when we take a look at the tech stack of all these organizations, it is scary to see how complex they are and how many vectors of potential attack exist.
From this we can see a bunch of positive signals, SPF usage, Cloudflare against DDoS, lots of different cloud services from AWS, Azure to GCP.
But we also see some concerning signals (not necessarily negative, but some that if we were the attackers, we would want to start with), usage of Tomcat (which is widely known for having multiple vulnerabilities), lots of Windows servers including Microsoft Windows RPC.
We might explore more indepth, what some of these services are in a future post but one interesting fact I found was, for any organization loaded on ASM we give it a risk level, and for this portfolio of organizations the risk level looks like this:
- Low - 72364
- Medium - 60623
- High - 420
- Critical - 132
Lets ignore Low, Medium and High for a minute. One of the important things to understand about what we do on ASM with critical issues, is that these are curated and have custom modules developed for them that guarantee an extremely high level of accuracy for that finding without exploiting the vulnerability.
We also consider as critical, a vulnerability that would allow any type of attacker easy (we classify easy as 1 command or available script copy pasted into a terminal) access to a company asset (asset is classified as machine, or proprietary data).
So knowing that, the number that is concerning there, is the 132.
Taking a look at some of the critical findings, we see that they are comprised of exposed databases, vulnerable services that are typically used by threat actors to deploy ransomware, multiple critical services with no authentication… Not good.
These services are spread across multiple ports however by looking at the sankey diagram of service-port we can see a high diversity of services can be found on port 80 and 443.
One final interesting fact is that all the data we looked at over the course of this post, was on lite mode in ASM, which means we are only looking at 250 ports and without domain enumeration expansion (finding domains other than the main domain provided). Had I put these companies in extended mode, we would get all their alternative domains and 65535 ports for all assets which easily means 10-30x the attack surface seen on this post. I’d like to thank Florentino Bexiga and Filipe Reis for the assistance with this post.
Subscribe to my newsletter to get updates and new articles right in your inbox!